Watch Dashboard
The Watch Dashboard (WDB) is your primary space for monitoring the status of a watch and checking on the well-being of a watch wearer. To the left is a collapsed menu that you can expanded by mousing over or tapping on the menu area.
If you have permission to view only one watch, that watch is selected automatically. If you are managing multiple watches, you see the Devices list when you first log in. You can select a device by search for the assistee's name or the watch serial number.
With a watch selected, you get a full summary view of the watch status and wellness statistics. Below are detailed descriptions of each area of the WDB.
Latest status
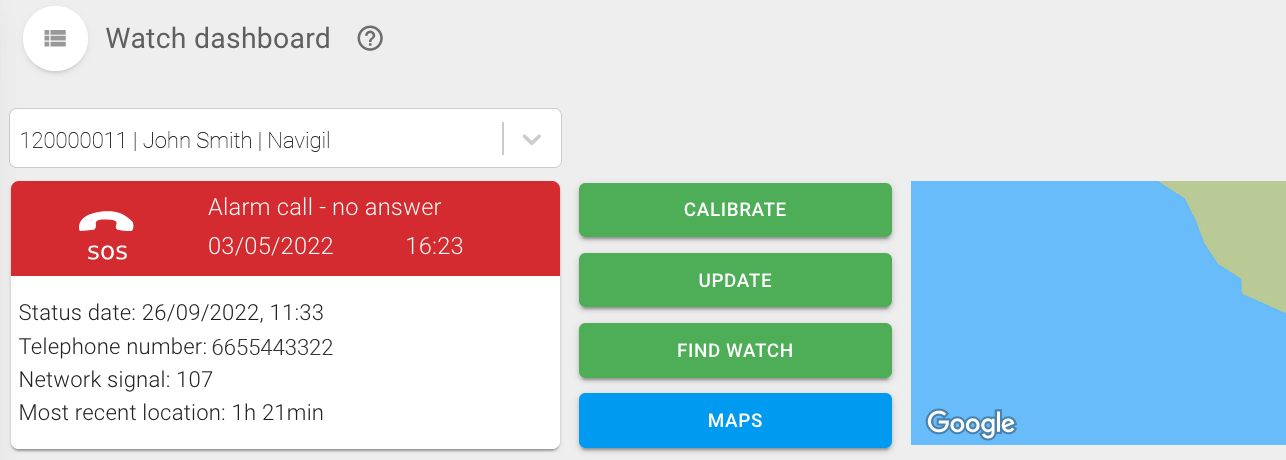
The top frame of the WDB shows all the essential details of the selected watch. In addition, you have quick access to key actions:
- Calibrate: reset the watch time
- Update: refresh the watch status information
- Maps: go to map to see location history
- Calendar Page: go to the calendar page to view key events
If there is an active alert, it is displayed in the latest status and can also be viewed in the ALERTS tab below.
Next to the basic status information is a map view showing the watch location (if location data is allowed for the watch). The map view is updated automatically. You can see the age of the most recent location in the watch details to the left. Click the LOCATE button above the map to update the location immediately.
You can also start (and stop) emergency tracking from this view by clicking the START EMERGENCY TRACKING button. When emergency tracking is on, the location is checked every few seconds, and the map view is updated accordingly. Keep in mind that emergency tracking requires full GPS power on the watch, so battery usage goes up significantly. Turn off emergency tracking as soon as it is no longer needed.
If a watch has been misplaced, click the FIND WATCH button to make the watch emit a beeping sound that helps you find it. The beeping can be stopped from the watch or by pressing Cancel Find Watch on the dashboard.
Charts
By default the WDB displays a charts grid below the latest status frame. If you don't see this, click the CHARTS tab below the latest status frame. The charts provide a visual summary of key statistics. You can filter which charts are displayed using the filter button to the right.
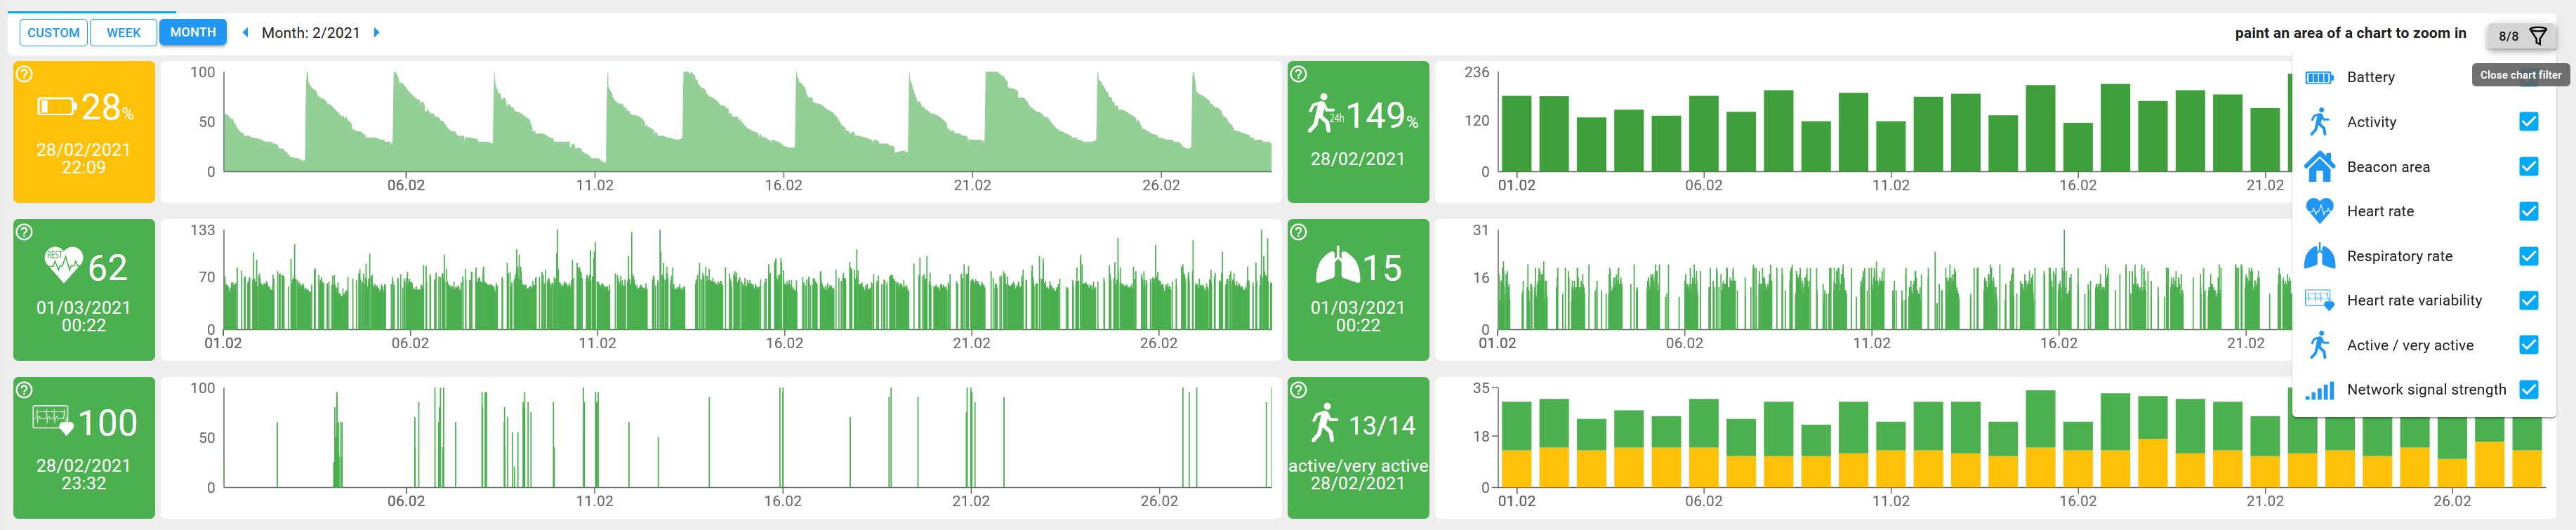
The default time period of the summary is one month. You can change the month by clicking the arrows left or right of the date. Click the WEEK button to change to a one-week view. Alternatively, you can click the CUSTOM button and set a specific time range.

Once you have selected a time period, you can zoom in and out on any of the graphs by painting (highlighting) a particular area of the graph to zoom in. Click ZOOM OUT to return to the full view.
Alerts
Click the ALERTS tab to see a list of active alerts and warnings. There is two types of notifications listed here:
- Notifications that are dismissed automatically, like the battery low notification which is updated with a charging and full notifications when the watch is in the charging dock.
- Notifications which require manual action to dismiss, such as leaving home area.
Dismiss notifications in the list by clicking the entry and clicking the DISMISS NOTIFICATION button.
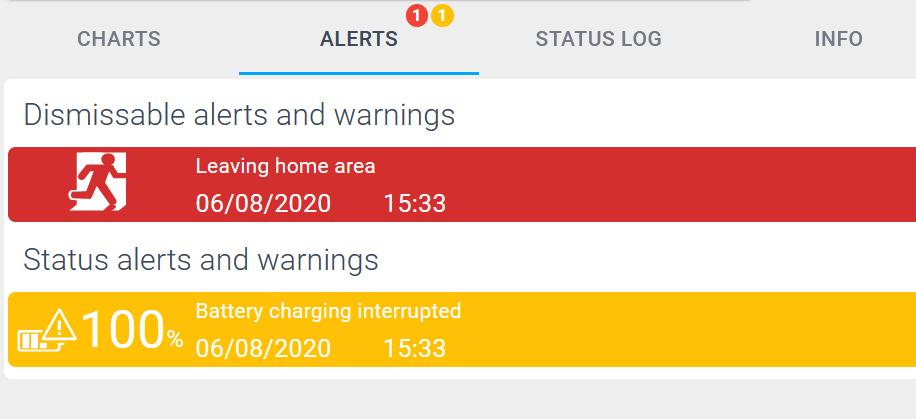
Dismissable alerts and warnings include:
- No connection
- SOS Call, no answer
- Device left area - "[area name]"
- Device left home area
- Prohibited area enter
- Man down
- No movement
- Battery empty - shutdown
Status alerts and warnings include:
- Battery low
- Battery charging error
- Battery charging interrupted
- Connection warning
- Home beacon power warning
- Watch clock hands calibration warning
Status log
Click the STATUS LOG tab to view a complete list of all notification for the selected watch. The quick filters at the top show how many entries there are for the notification type. You can also search notifications using the keyword search field below the filter buttons.

Info
Click the INFO tab to see details about the watch hardware, software and other information.
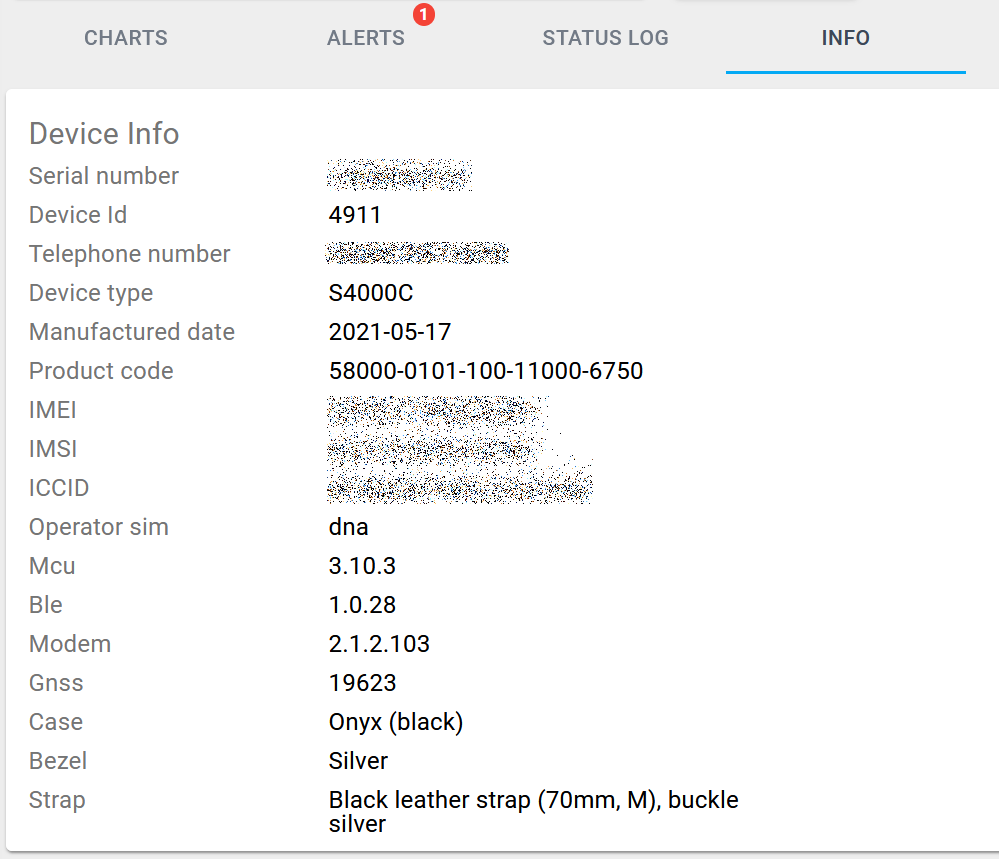
Device info includes:
- Serial Number: product serial number
- Device Id: unique number used in Navigil Service
- Telephone Number: SIM phone number
- Device Type: hardware version
- Manufactured Date: date of manufacture
- Product Code: product type identifier (internal use)
- IMEI: International Mobile Equipment Identity
- IMSI: International Mobile Subscriber Identity
- Operator SIM: network operator
- MCU: firmware version
- BLE: Bluetooth firmware version
- Modem: modem firmware version
- GNSS: GNSS chipset firmware version
- Case: watch case color
- Bezel: watch bezel color
- Strap: watch strap type, color, size and material
Call log
Click the CALL LOG tab to see a complete history of both regular and SOS calls. The quick filters at the top show the number, type and success of calls.
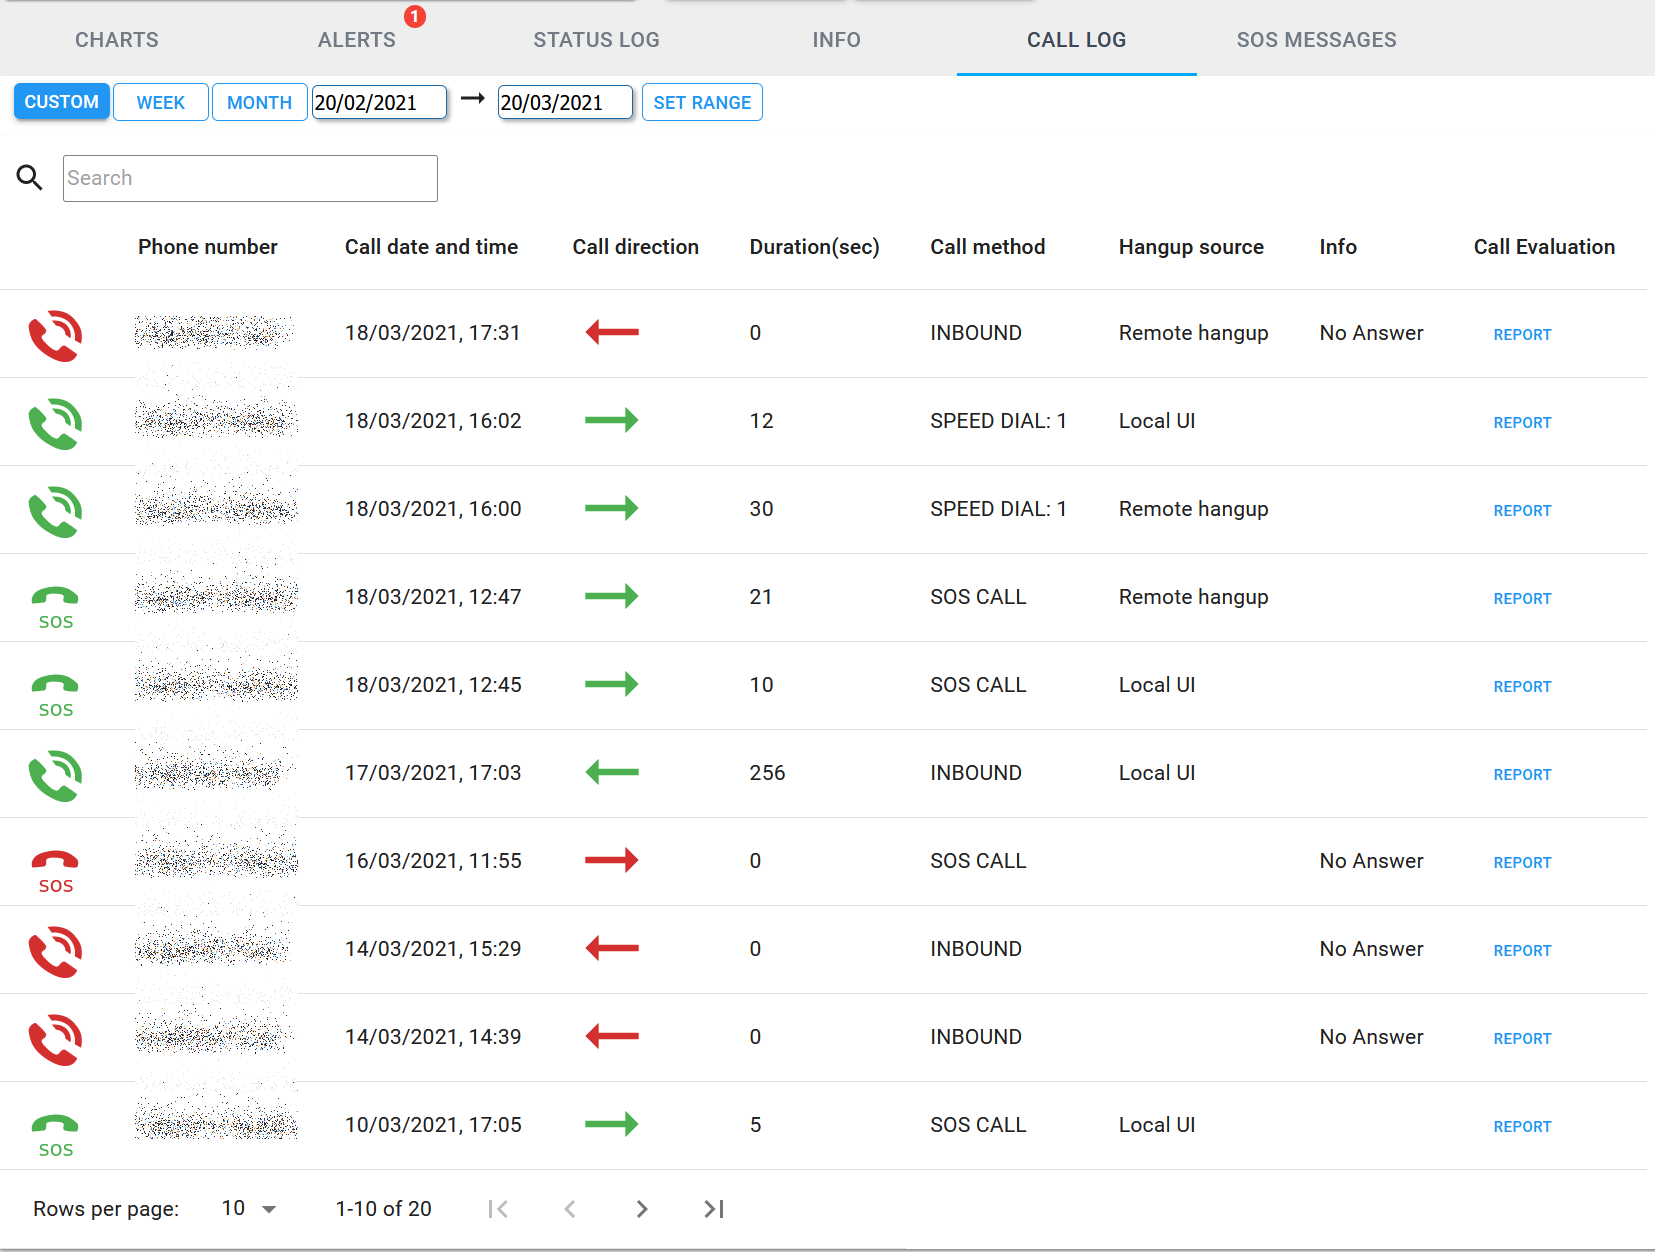
Each call log includes the number that was called, the direction of the call (outbound arrow right, inbound arrow left), time, date, duration, method, as well as how the call was ended (hang-up source) and further info. Generally, green indicates a successful call, and red indicates the call failed.
If a call is not answered, the duration is 0 and in the Info column there is a note ‘No answer.’ The call method shows if the call is an SOS call or a normal call to a certain speed dial number. Speed dial numbers are the contacts defined under Device settings Contacts. In the Hang-up source column, the options are 'Local UI' when watch user ends the call and 'Remote hang-up' when the call is ended from the call receiver. Undefined indicates the call ended for some other reason, such as a poor connection. You can also add a call evaluation by clicking REPORT.
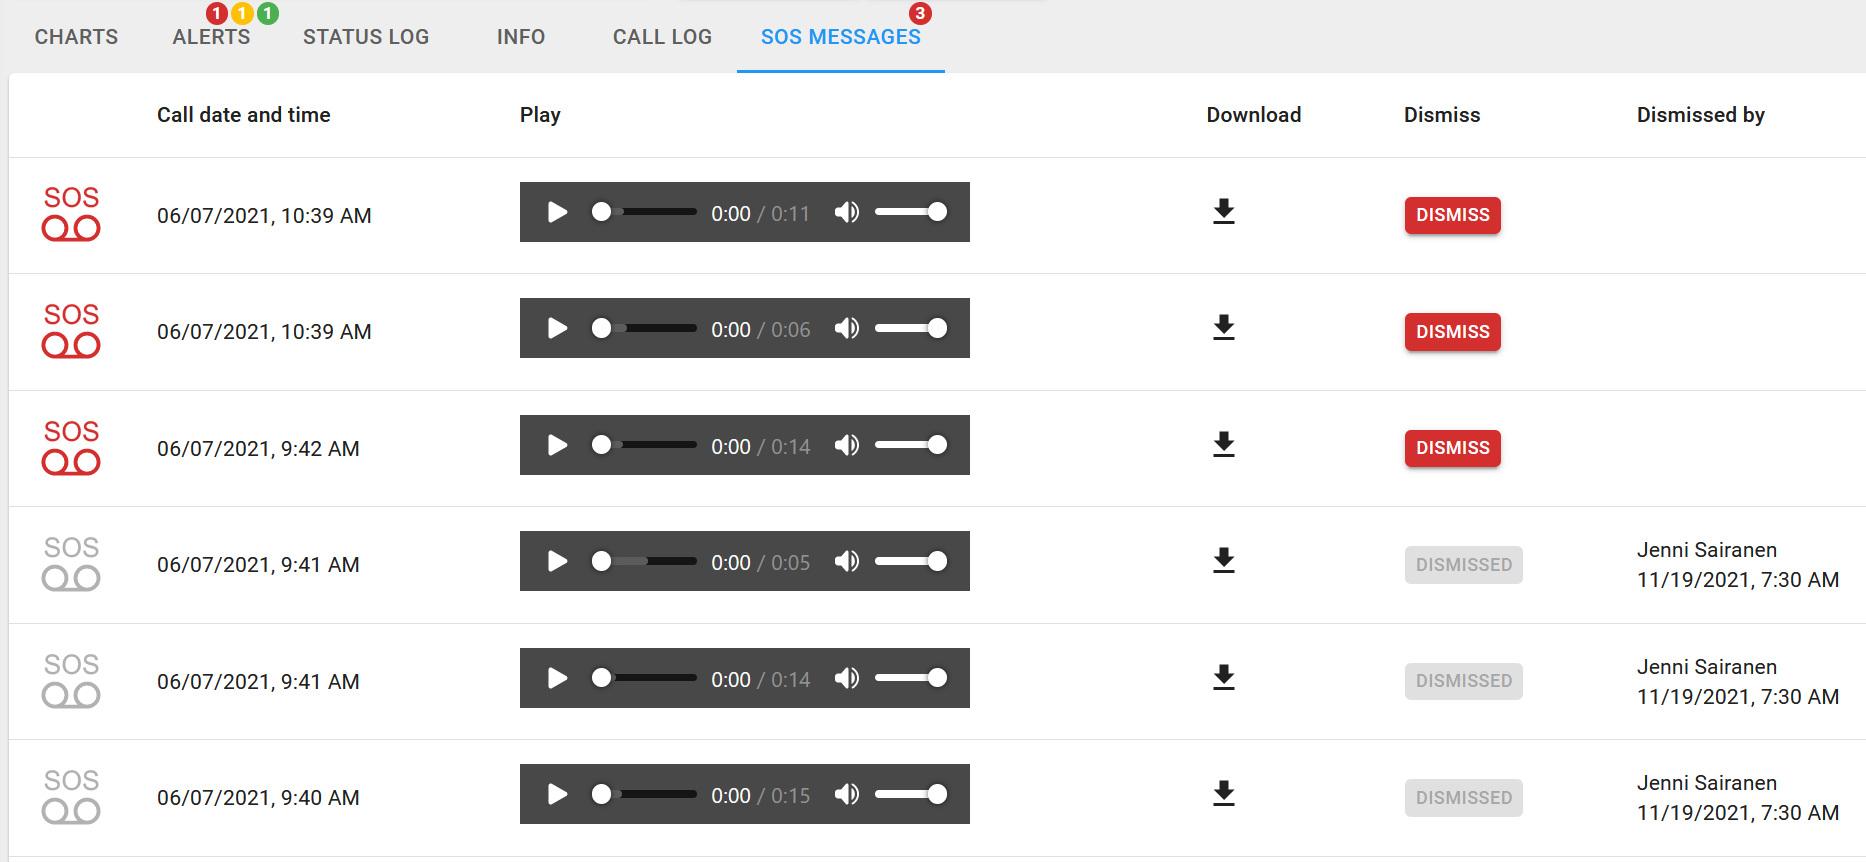
SOS messages
Click the SOS MESSAGES tab to access recorded SOS messages. You can play the message directly in the Service and download the audio file. There is no limit to how many times the message is played. SOS message alerts (also shown in ALERTS tab) can be dismissed from this tab.
You can also add an email notification for recorded SOS message alerts under the Alarms and notifications settings.